Start here: this article is part of our selling your home collection. For the full picture, read our complete guide, How to Sell Your House Fast: The Complete Homeowner's Guide.
Quick answer: In SilverCrest Estates' study of 590 U.S. cities using Census ACS 2024 5-year data, 16 cities have a median home built in 1939 or earlier, led by St. Louis, Buffalo, Rochester and Providence. The typical city in the study has a median build year of 1978. Older housing goes with lower owner-occupancy: 43% in the oldest group versus 69% in the newest.
- 119 of 590 cities (20%) have a median year built before 1960.
- 289 cities (49%) have a median before 1978, the federal lead-paint disclosure cutoff.
- The full dataset is free to download as a CSV below.
What this study measures
This is a data study for homeowners, built entirely from official U.S. Census Bureau figures. For each city SilverCrest covers, we looked at two things that shape what selling is like: how old the typical house is, and how many homes are lived in by their owners rather than rented.
Older housing matters to sellers because age predicts the repair questions buyers, inspectors and lenders raise. Owner-occupancy matters because it tells you who you'll compete with on the market and how many neighbors are making the same decisions you are.
Methodology
Source and vintage. All figures come from the U.S. Census Bureau's American Community Survey (ACS) 2024 5-year estimates, which pool responses collected from 2020 through 2024. We used four tables: B25035, median year structure built; B25003, tenure (owner- versus renter-occupied homes); B01003, total population; and B25077, median home value. Responses were downloaded from the Census Bureau's official data service and archived unchanged.
Places. We matched each of SilverCrest's 598 city pages to one Census place (a city, town or census-designated place). Owner-occupancy is owner-occupied units divided by all occupied units.
Missing data. Eight towns in New Hampshire, New Jersey, Rhode Island and Vermont (Salem, Merrimack, Edison, Coventry, Cumberland, North Providence, Essex and Colchester) are towns or townships the Census reports as county subdivisions, so they had no single matching place. We excluded them rather than substitute another area. Every one of the remaining 590 places had all four figures.
The 1939 floor. Table B25035's oldest category is "built 1939 or earlier." When a city's median falls in that bin, the Census reports it as "1939-" with a placeholder estimate, so we show those 16 cities as "1939 or earlier" and rank them together, ordered by population.
How the housing-age study was built
- 1
Pull ACS 2024
Four official Census tables.
- 2
Match places
598 city pages to Census places.
- 3
Exclude gaps
8 towns with no single place.
- 4
Rank 590 cities
By median year built and ownership.
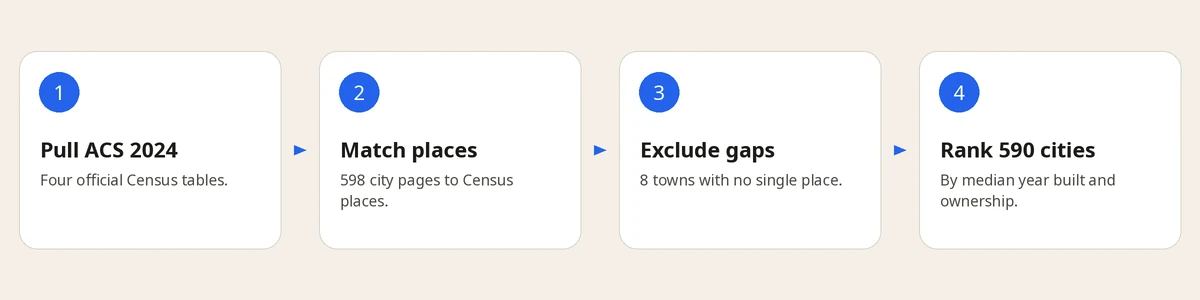
How the study was built; full data in the CSV download below.
Which cities have the oldest homes?
These 16 cities have a median home built in 1939 or earlier, the oldest group among the 590 studied, listed from largest to smallest population.
| City | Median year built | Owner-occupied |
|---|---|---|
| St. Louis, MO | 1939 or earlier | 45.3% |
| Buffalo, NY | 1939 or earlier | 43.0% |
| Rochester, NY | 1939 or earlier | 38.1% |
| Providence, RI | 1939 or earlier | 41.4% |
| New Bedford, MA | 1939 or earlier | 40.3% |
| Reading, PA | 1939 or earlier | 40.6% |
| Cicero, IL | 1939 or earlier | 54.6% |
| Somerville, MA | 1939 or earlier | 34.2% |
| Scranton, PA | 1939 or earlier | 49.9% |
| Passaic, NJ | 1939 or earlier | 23.8% |
| Lancaster, PA | 1939 or earlier | 48.6% |
| Troy, NY | 1939 or earlier | 37.4% |
| Williamsport, PA | 1939 or earlier | 43.0% |
| Newport, RI | 1939 or earlier | 49.8% |
| Rutland, VT | 1939 or earlier | 54.9% |
| Brattleboro, VT | 1939 or earlier | 50.7% |
Next come Utica, NY (1940), Cleveland, OH and Schenectady, NY (1941), York, PA (1941), Pittsburgh, PA and Newton, MA (1942), Wilkes-Barre, PA (1943), Altoona, PA (1944) and Fall River, MA (1945). Population for every city is in the CSV.
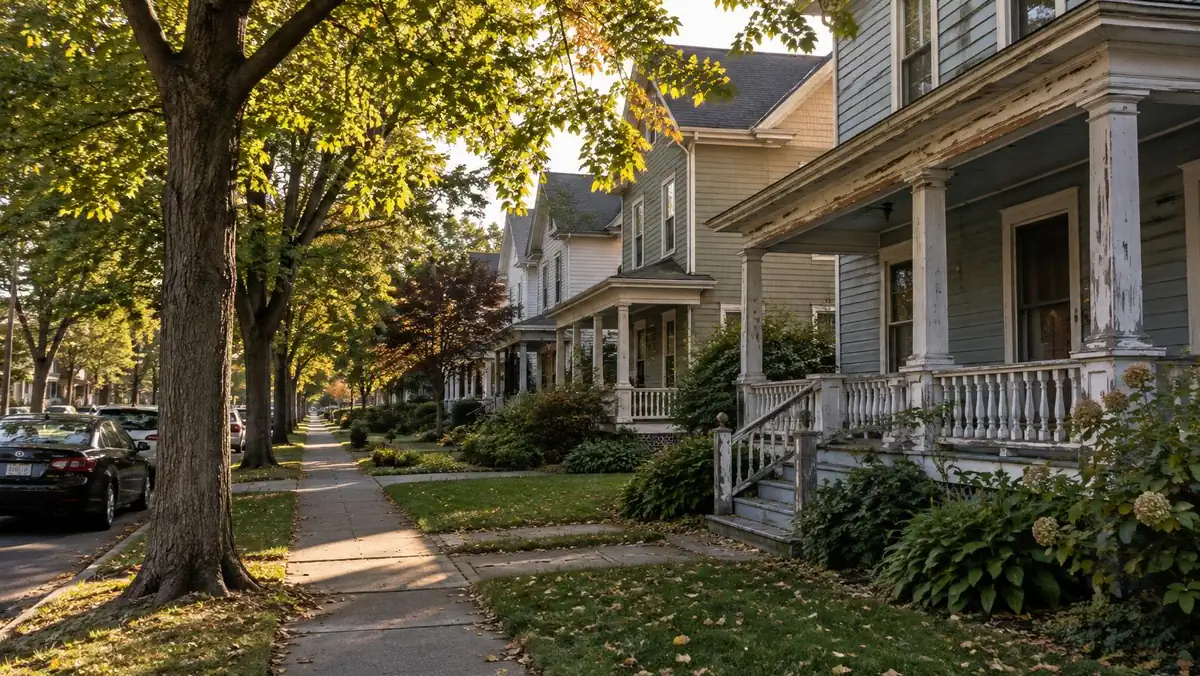
Among the 25 oldest, Pennsylvania has eight cities and New York five. Most are former industrial cities of the Northeast and Great Lakes, where much of the housing went up before World War II. See our Pennsylvania page, New York page and Missouri page for local selling details.
Among the 25 oldest, Pennsylvania has eight cities and New York five.
Which cities have the newest homes?
At the other end, Buckeye, AZ has the newest typical home, with a median year built of 2011 and 86.0% of homes owner-occupied. Frisco, TX follows at 2009. Bentonville, AR, South Jordan and Lehi, UT, Goodyear, AZ, Meridian, ID, McKinney, TX and Enterprise, NV all have a 2007 median, and Kapolei, HI has 2006. Most are fast-growing suburbs in the South and West.
Do older cities have fewer owner-occupied homes?
Grouping the 590 cities by their median build year shows a steady pattern: the older the housing, the smaller the share lived in by owners.
| Median year built | Cities | Median owner-occupied share |
|---|---|---|
| 1939 or earlier | 16 | 43.0% |
| 1940–1959 | 103 | 49.1% |
| 1960–1979 | 198 | 56.8% |
| 1980–1999 | 230 | 57.5% |
| 2000 or later | 43 | 69.1% |
One likely reason: older cities have more two- to four-unit buildings and rentals. The data shows the association, not the cause.
Old homes, mostly owner-occupied
Some cities pair old housing with high ownership, where many owners face the same repair decisions. These have a median year built before 1960 and the highest owner shares:
Anaconda, MT (median 1954, 73.0% owner-occupied), Parma, OH (1958, 72.4%), Butte, MT (1957, 70.7%), Newton, MA (1942, 70.0%), Weirton, WV (1958, 69.3%), Dearborn, MI (1952, 68.4%), Cranston, RI (1958, 67.6%) and West Hartford, CT (1954, 67.4%) lead this group.
The oldest and newest states
Statewide medians from the same ACS release: the District of Columbia (1958) and New York (1959) have the oldest housing, followed by Rhode Island (1962), Massachusetts (1964) and Pennsylvania (1965). Nevada (1996) has the newest, with Georgia, South Carolina, Texas and Utah tied at 1992.
What housing age means if you're selling
Age doesn't decide price, but it predicts which questions come up:
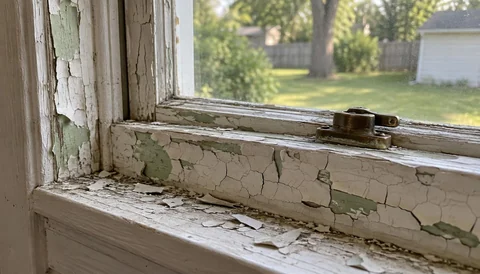
- Built before 1978: the federal lead-based paint disclosure applies to most homes. That covers the typical home in 289 of the 590 cities.
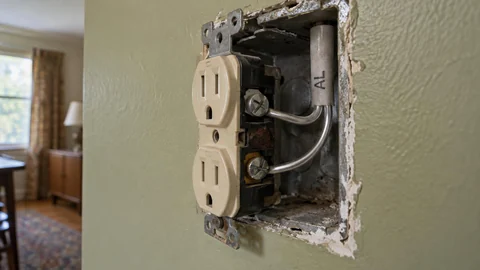
- Built 1965 to the mid-1970s: the Consumer Product Safety Commission says homes from this era may have aluminum branch wiring. 120 cities have a median build year from 1965 through 1975.
- Any older home: original systems, past additions and old materials such as asbestos are common inspection topics.
Older homes aren't harder to sell. They just reward preparation: gather records, disclose what you know, and decide which repairs pay back using what not to fix when selling a house.
Limits of this study
ACS figures are survey estimates with margins of error, and small places have wider margins. A 5-year estimate describes 2020–2024 on average, not a single year. A median build year describes the typical home, not yours: a 1950s city can contain new construction, and vice versa. Place boundaries don't match ZIP codes or neighborhoods. Check your own home's year built on your deed or tax record.
Download the data
Download the full dataset (CSV, 590 cities): state, city, Census place and GEOID, median year built (with the 1939 note), owner and renter shares, occupied units, population, median home value and our city page link. Journalists and researchers may reuse it with credit to SilverCrest Estates and the U.S. Census Bureau.
When a cash sale may not be your best option
If your older home is updated, well documented and move-in ready, listing it may net more than a cash sale. Compare written numbers with our cash offer vs listing guide.
If the age is showing and you'd rather skip repairs, SilverCrest Estates buys older homes as-is. Close in as little as 21 days when title and transaction requirements allow. Request a no-obligation cash offer and see our property condition page.
Key takeaways
- 16 of 590 cities have a median home built in 1939 or earlier.
- Half of the cities studied have a typical home from the lead-paint era (pre-1978).
- Older-housing cities have lower owner-occupancy, 43% versus 69% in the newest group.
- All figures are official ACS 2024 5-year estimates; the CSV is free to reuse with credit.
Frequently asked questions
Which cities have the oldest homes?
In our ACS 2024 study of 590 cities, 16 have a median home built in 1939 or earlier, led by St. Louis, Buffalo, Rochester and Providence.
Which cities have the newest homes?
Buckeye, AZ has the newest typical home (median 2011), followed by Frisco, TX (2009) and several 2007 cities including Bentonville, McKinney and Meridian.
Do older cities have fewer owner-occupied homes?
In this data, yes: cities with a median home from 1939 or earlier have a 43% median owner-occupied share, versus 69.1% where the median is 2000 or later.
Sources & further reading
Primary sources we consulted for this article. Rules vary by state and change over time — always confirm against the original source.
- 1Table B25035: Median Year Structure Built (ACS 2024 5-Year)
U.S. Census Bureau
Median year built; lowest bin is 1939 or earlier.
- 2
- 3
- 4Table B25077: Median Value, Owner-Occupied Units (ACS 2024 5-Year)
U.S. Census Bureau
Median home value in the CSV.
- 5Real Estate Disclosures About Potential Lead Hazards
U.S. Environmental Protection Agency
Pre-1978 lead-based paint disclosure.
- 6Repairing Aluminum Wiring (Publication 516)
U.S. Consumer Product Safety Commission
The 1965 to mid-1970s aluminum wiring window.

About the author
Alex Chen
Market Research Lead
Alex Chen works with the SilverCrest Estates acquisitions team, helping homeowners across 50+ US markets understand their options and close on their own timeline.
Disclaimer: This article is for general information only and is not legal, tax, or financial advice. Real estate rules vary by state and change over time. Consult a licensed attorney, tax professional, or financial advisor about your specific situation before acting.